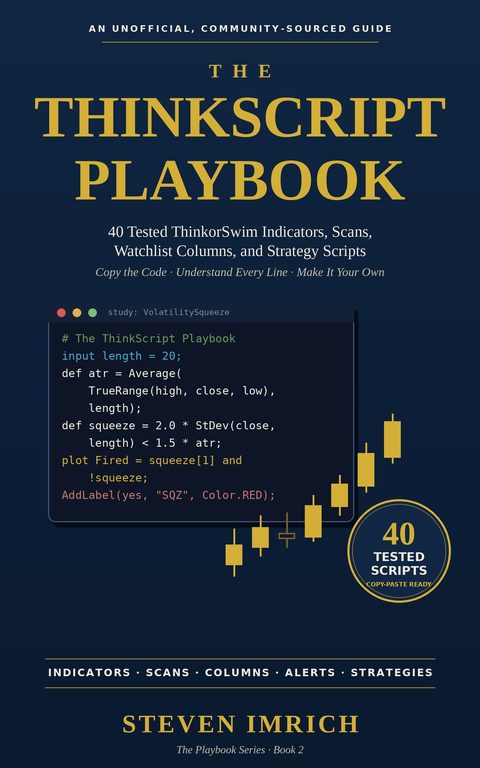
The ThinkScript Playbook
40 tested ThinkorSwim indicators, scans, watchlist columns and strategy scripts
The code is the easy part. Knowing what is worth building — and what is a waste of screen space — is the harder half, and it is why this book is organised around working scripts rather than language reference. Every script is explained line by line, and every script is told where it breaks.
Buy on AmazonWho it is for
- You can read a chart but have never written a study.
- You keep pasting scripts from forums without knowing what they do.
- You want the scanner to find setups instead of scrolling watchlists.
What it covers
- Ten minutes to a first working script, then the fraction of the language that does most of the work.
- Custom studies that earn their place — anchored VWAP, deviation bands, prior-day and overnight levels, opening-range boxes, relative volume, ATR trailing stops.
- Scanner setups that turn Stock Hacker into a screener, plus watchlist columns and strategy scripts.
What our own research measured
Writing a study is one thing; knowing whether the thing it plots is worth trading is another. Here is what four of the conditions you might code up actually did across 12,050,609 occurrences, 1994-2026, measured against the market over the next 21 trading days. Our free ThinkScript study below plots exactly these.
| Formation | Occurrences | Before 2018 | Since 2018 | All years | Verdict |
|---|---|---|---|---|---|
| One-day pop: +10% on volume | 48,992 | -1.30% | -6.88% | -4.50% | Lagged the market, both eras |
| Vertical run: +20% in 2 weeks | 527,370 | -1.15% | -3.71% | -1.85% | Lagged the market, both eras |
| 2 sigma above its band | 1,098,962 | -0.22% | -1.40% | -0.53% | Lagged the market, both eras |
| Pullback in an uptrend | 1,087,083 | +0.39% | -0.43% | +0.18% | Led the market, both eras |
Read from our Formations study, which is rebuilt every morning. "Before 2018" and "Since 2018" are two independent halves of the sample: a formation only counts as reliable if it did the same thing in both. Averages are tilts across hundreds of thousands of events and say nothing about any single trade.
See the whole study, and get the free ThinkScript that plots it →
A free ThinkScript study to start from
Before you buy anything: we publish one of our own studies free, with the code in full and every line explained. It is not from any book — it is built from the research above.
Get the free scriptGet the book
The ThinkScript Playbook is on Amazon in Kindle and paperback.
Buy on AmazonSee the other books