Seven tools on top of the same data.
A subscription is not only the files. It also opens a members area with seven ways of looking at the market without writing a line of SQL — what just happened, when several insiders move together, who is worth watching, whether a rule would have paid, which calendar windows have repeated for decades, and what actually follows the chart patterns everyone talks about — plus email alerts and an API so you do not have to come looking.
The Filings Browser
The feed of every insider buy and sell of the last two years runs down the left. Click any one and that company opens on the right — its price chart, and all of its filings. 44,384 filings across 4,577 tickers: 24,316 open-market purchases worth $37.1 billion, and every sale of $1 million or more, with new ones landing every morning. Green up-triangle bought, red down-triangle sold, filled for officers and directors, hollow for 10% owners and funds — so you can tell at a glance whether the buyer was in the room or just on the register.
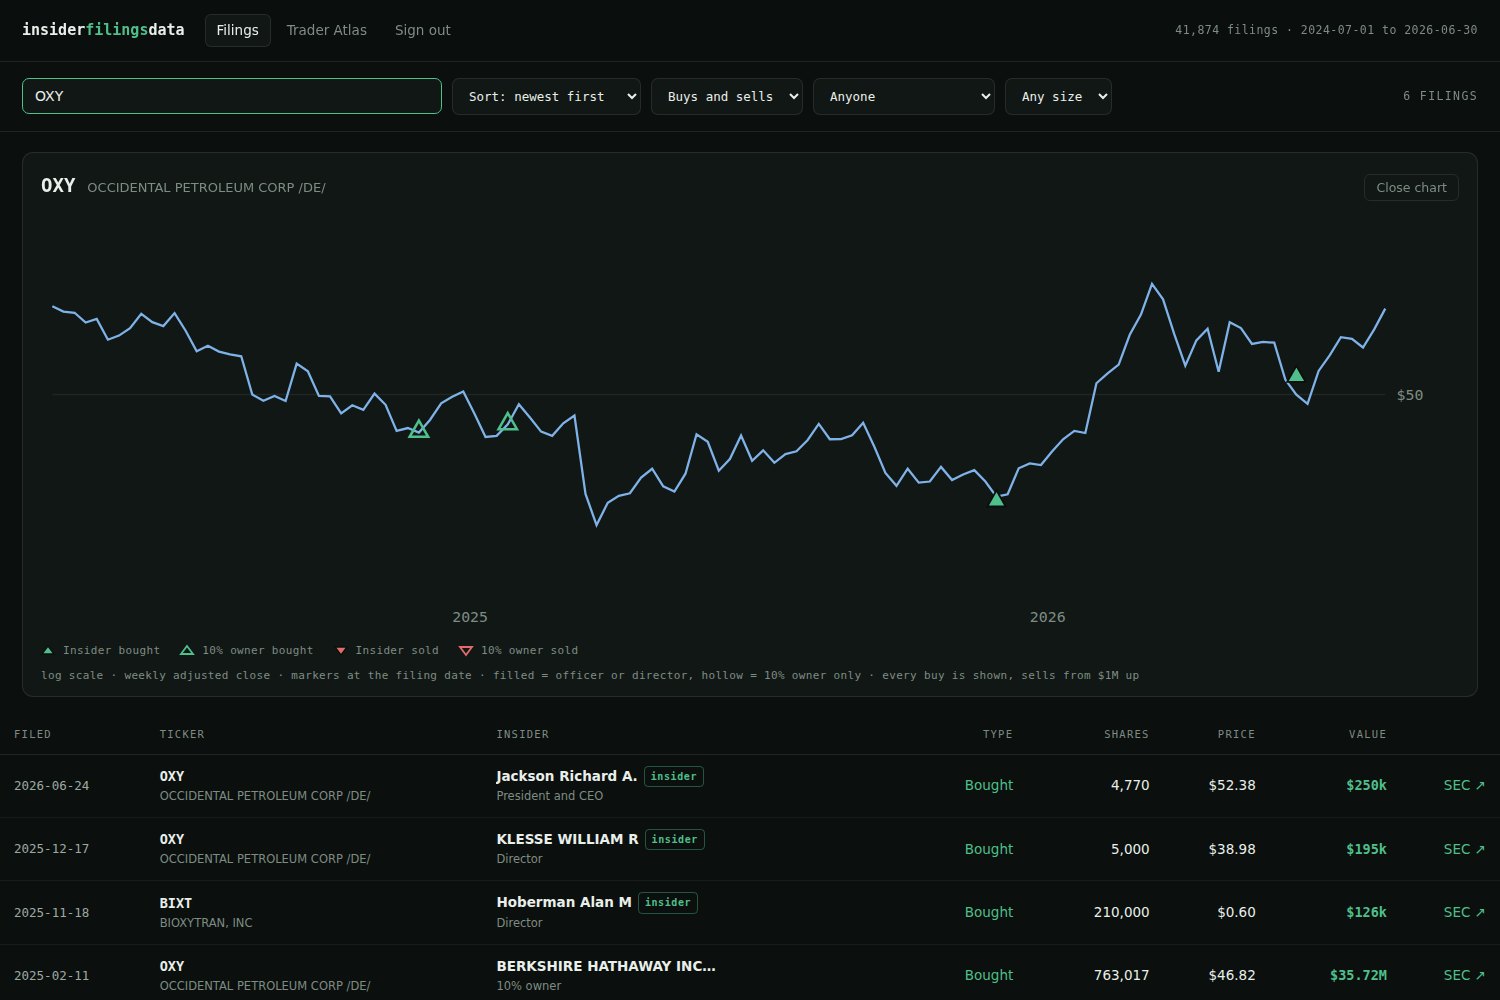
Search Berkshire and 38 filings worth $14.1 billion come back across six tickers. Search Musk or Bezos and you get the same thing for a person. Filter to $10M+ buys by officers and directors, sort by size, and read down. Every row links to the original SEC document.
Cluster Buys
One insider buying is a data point; three or four buying the same stock inside a few weeks is a decision the whole room made. The Cluster page finds every window where at least three distinct insiders bought on the open market and scores each 0–100 — on how many bought, whether a CEO, CFO or chair was among them, how much went in, and whether anyone was making their first-ever or largest-ever purchase. The score is broken down so you can see exactly why, the buys are shaded on the price chart, and buying that is really an IPO allocation or a priced placement is caught and marked rather than flattering the list. This is the single feature owners of every other tool ask for and cannot get.
Trader Atlas
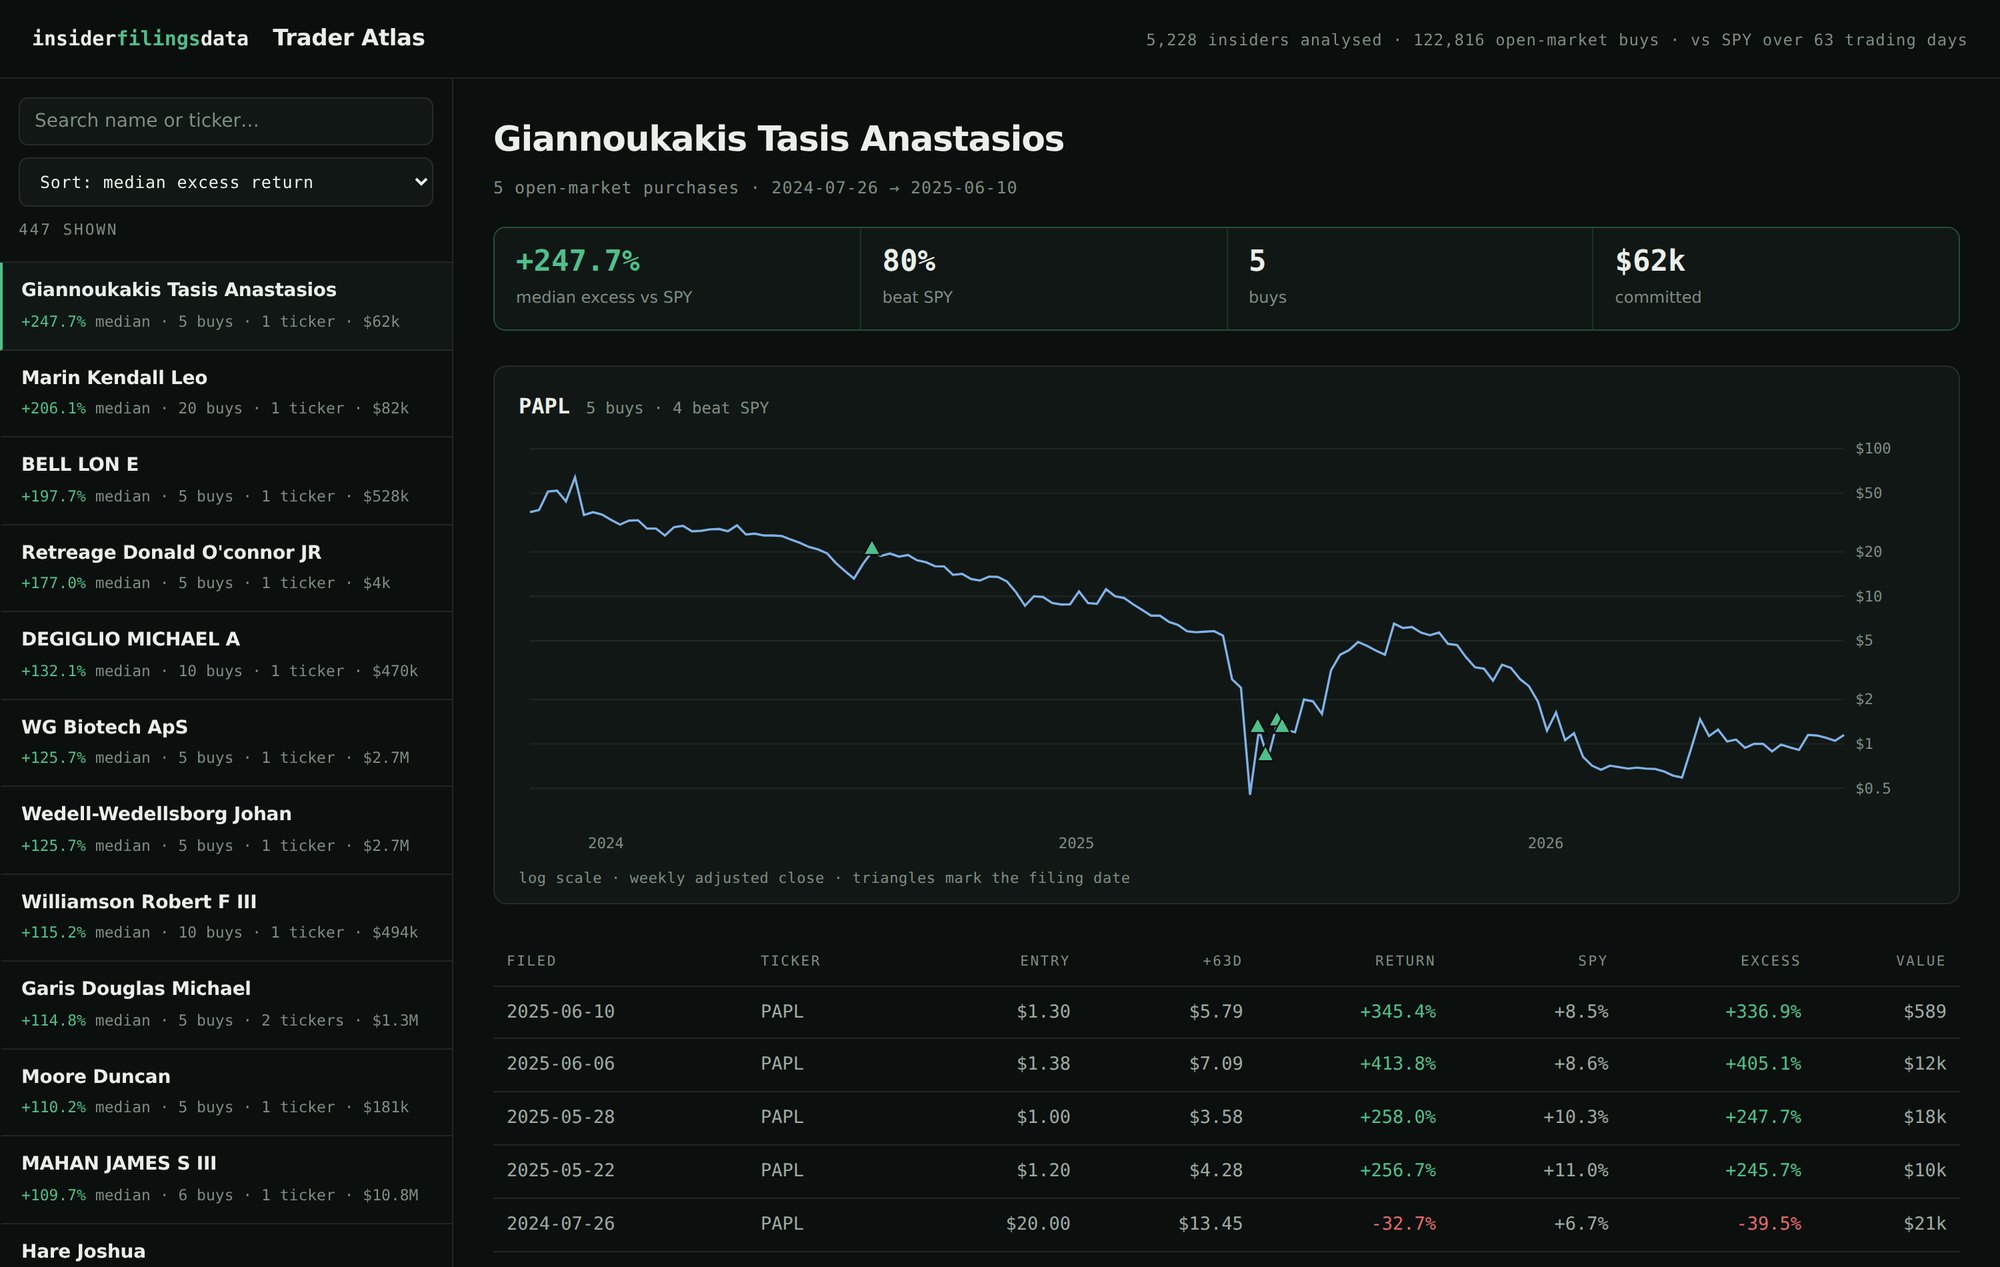
The browser tells you what happened at a company. The Atlas asks the other question: which insiders have a history worth paying attention to. 447 filers with at least five open-market purchases, ranked by the median excess return that followed them, each buy marked on the price chart with the full transaction list underneath.
Seasonal
279 calendar windows across 248 stocks that were found on pre-2018 price history alone and then repeated in at least 75% of 2018–2025 — eight years the search never saw. Mettler-Toledo's late-October run: 25 of 28 years, 8 of 8 since 2018. Every pattern shows both records, every year's return, and the next occurrence drawn ahead of today — plus a signal-check banner that reports how many "patterns" the same tests find in calendar-scrambled noise, so you always know how much to trust the list.
Formations
We ran 16 classic chart patterns — golden cross, oversold RSI, 52-week highs, volume spikes — across 12 million occurrences and 64 years of prices, outcomes measured against the market. Five repeat in both eras. Three flipped sign after 2018. The golden cross does nothing, across 47,325 of them. Each formation is a page: its average path against the average stock's, the full outcome distribution, and a plain-language verdict. Members can also chart any of ~4,100 stocks with the formation arrows marked on the price, or pull the list of stocks where a formation fired today — refreshed every morning.
Read the study — the results are public →
Backtest
Every insider tool eventually raises the same question: would following this have paid? The Backtest answers it directly. Pick a rule — "a CFO buys over $250k", "three insiders buy in a cluster", "an officer buys on a 25% dip" — choose how long you hold, and it runs that rule across the last two years, measuring each trade's return against SPY over the same weeks. You get the win rate, the average market-adjusted return, the full spread of outcomes, and an equity curve against the market. It is an event study, not a trading simulation, and it says so plainly — a way to pressure-test an idea before you believe it.
Alerts & API
The last two tools mean you do not have to keep checking. Alerts email you the morning after a filing you care about lands — a watchlist of tickers or people, or market-wide signals like any CEO or CFO buying, or a fresh cluster — and only when something actually happened. The API hands the same buys, sells and cluster scores back as JSON, keyed to your subscription, so it drops straight into a notebook or a sheet; the dataset download also ships an MCP server, so you can ask the whole local database questions in plain language from Claude or Cursor.
Set up alerts → · Get an API key →
All of them live at insiderfilingsdata.com/members. Sign in with the email you subscribed with — we send a link, so there is no password to remember. None of them is a screener and none is advice; they are ways of looking at a public record that is otherwise very hard to look at.