The Filings Browser
Type a ticker. See every insider buy and sell of the last two years marked on the price chart, with the filings listed underneath and a link to the original SEC document on every row.
Two panes. On the left, every filing that matches your filters, newest first, scrolling on its own. On the right, whichever company you picked — its price chart, and every filing for it beneath. Clicking a row on the left changes only the right, so you never lose your place in the feed.
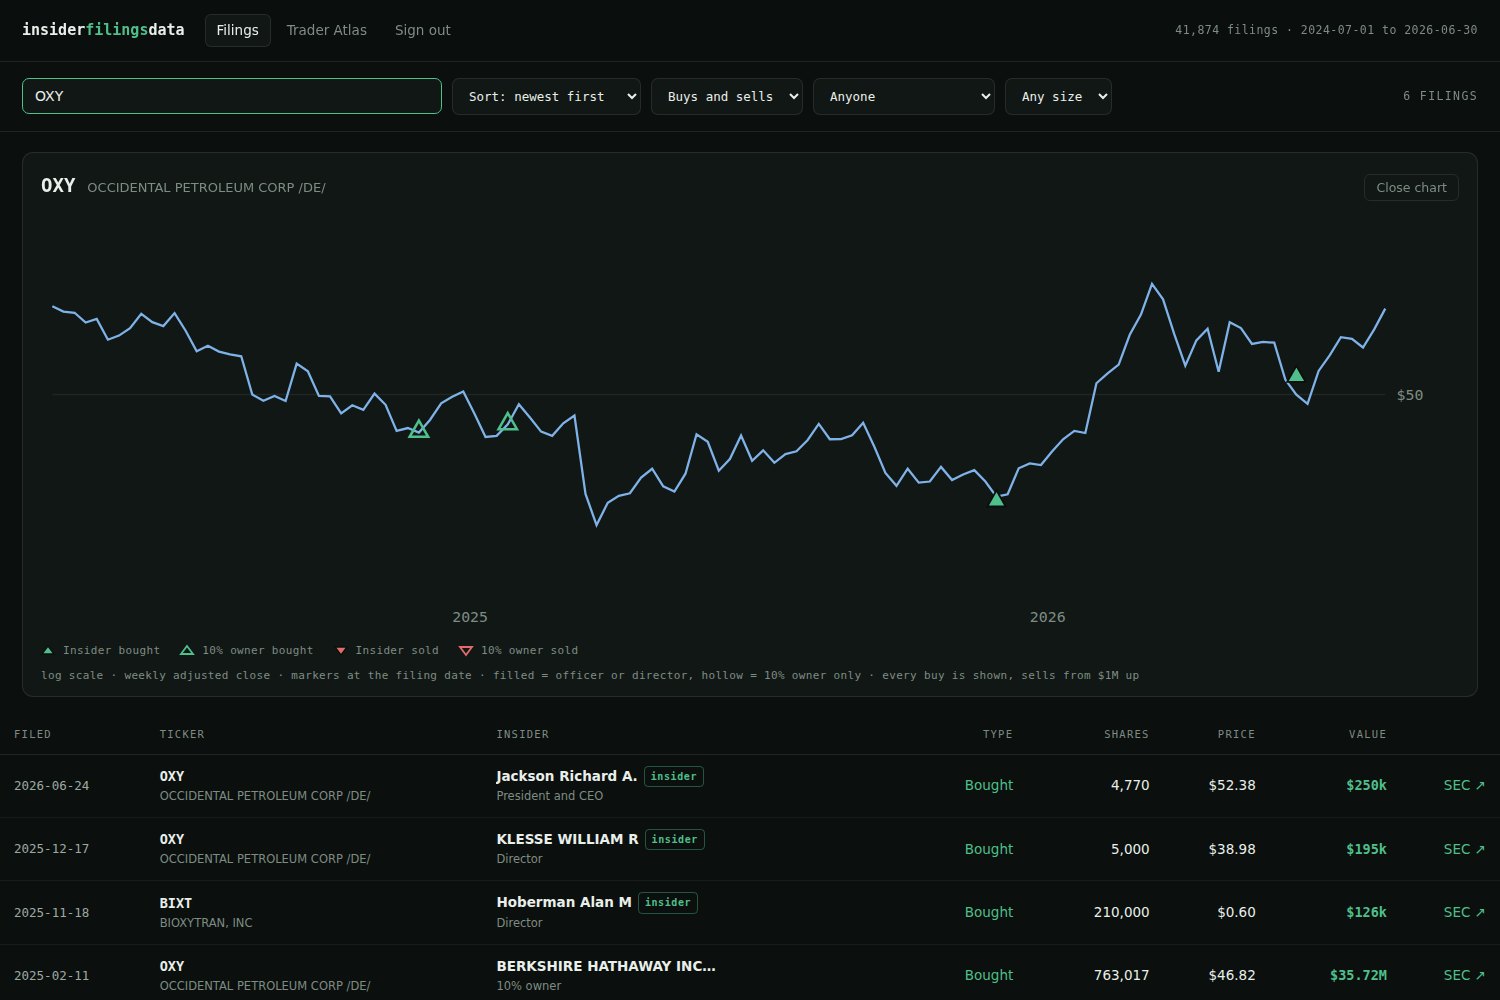
Occidental Petroleum, above. The two hollow triangles are Berkshire Hathaway adding to a position it already held — $409 million in December 2024, another $35.7 million that February. The filled markers are people: a director buying at $38.98 near the December 2025 low, and the chief executive putting $250,000 of his own money in at $52.38 the following June. Who bought, how much, and where the price was standing when they did — that shape is the entire point.
What you can ask it
- A ticker.
OXY,RIVN,NVDA— the chart opens on an exact match, and every filing for that company is listed below it. - A person.
Muskreturns six filings across two companies;Bezosreturns fifteen worth $10.8 billion. 15,102 named insiders and filing entities, matched on any part of the name. - An institution.
Berkshirereturns 38 filings worth $14.1 billion across six tickers.KKR,VolkswagenandSumitomoall resolve the same way. - Nothing at all. Leave the box empty and you get the whole feed, newest filing first.
And how to narrow it
Four controls sit across the top: sort by newest or by dollar size, show buys only or sells only, restrict to officers and directors or to 10% owners and funds, and set a floor of $100k, $1M, $10M or $100M. They compose — "$10M+ open-market buys by officers and directors, largest first" is four clicks and no query language.
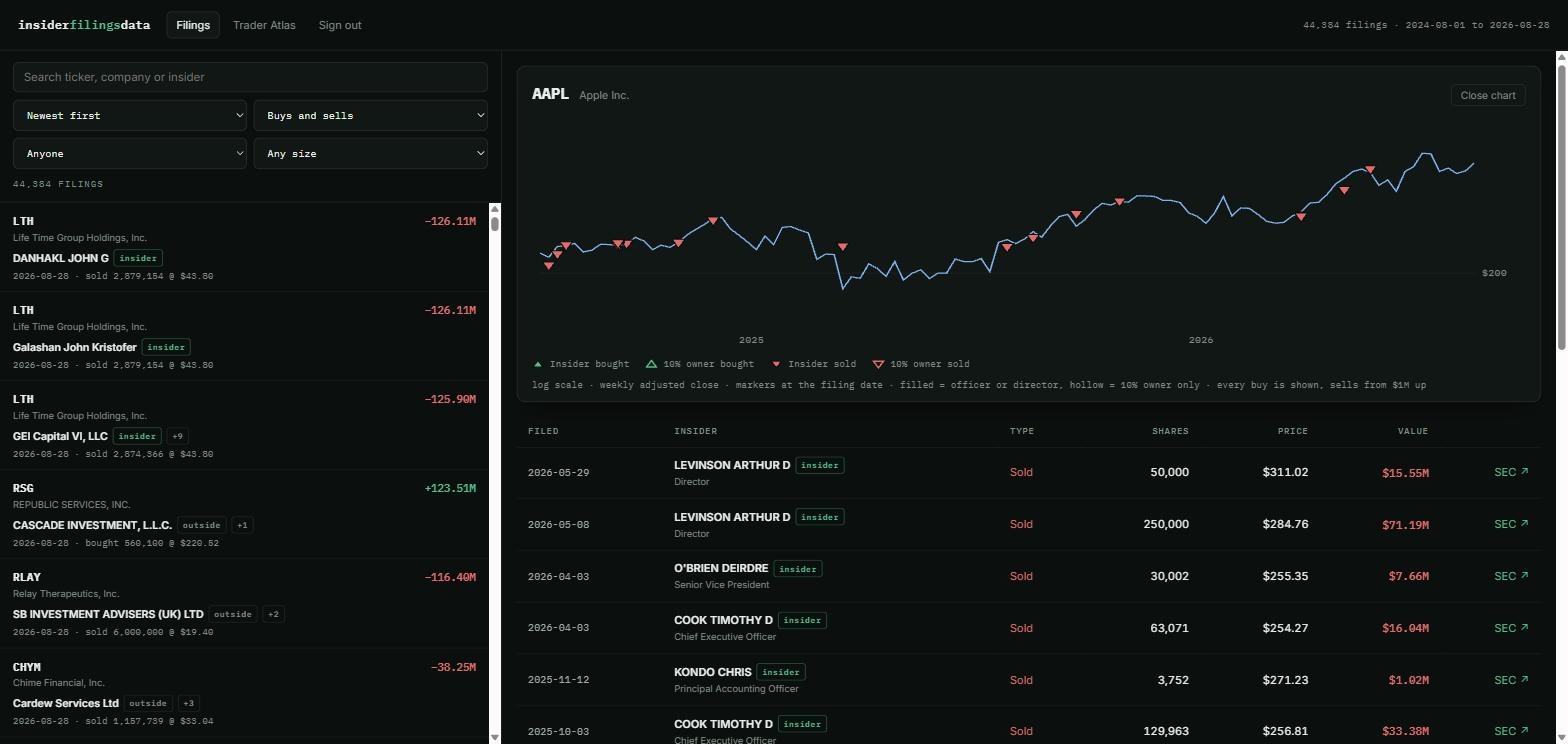
Apple over the same window, for contrast — twenty-three filings, every one of them a sale, into a rising price.
How to read the chart
Green up, red down
A green triangle pointing up is a purchase, a red triangle pointing down is a sale. Every purchase in the dataset is plotted. Sales are plotted from $1 million upward, because insiders at large companies sell constantly on schedule and plotting all of it would bury the signal under the payroll calendar.
Filled or hollow
A filled marker is an officer or a director — somebody who sits inside the company and knows what is coming. A hollow marker is a 10% owner or fund with no operating role. Both are legally insiders and both must file; only one of them was in the room.
Markers sit at the filing date — the day the public could have known — not the trade date, which is up to two business days earlier. The price line is the weekly split-adjusted close on a log axis, so a stock that moved from $3 to $60 stays readable across its whole range instead of flattening into the floor.
What is in it
44,384 filings
A rolling two years, currently to 28 August 2026, across 4,577 tickers. Price history for 95% of them.
24,316 purchases
Every Form 4 open-market buy — code P — in the window. $37.1 billion of it.
20,068 sales
Every disposition of $1 million or more, from Bezos down.
Where it comes from
The same place everything else here does: the SEC's EDGAR archive, parsed from the raw XML. Each row carries its accession number and links straight back to the filing it came from, so nothing you see has to be taken on trust. Grants, option exercises, tax withholding and gifts are excluded — those run on vesting schedules set years earlier and are not decisions anybody made this week.
What it is not
It is a record of what has already been disclosed, not a screener and not a signal. Insiders buy stocks that go on to fall and sell stocks that go on to double, and a chart makes coincidence look like pattern far more readily than a table does. Filers also mispunch share counts and prices sometimes, and those errors go into EDGAR unchallenged — we parse faithfully rather than quietly rewriting figures, so an outlier you find is a real outlier in the public record. Treat anything striking as a question worth looking into, never as an answer.
Getting in
The browser lives at insiderfilingsdata.com/members. Sign in with the email address you subscribed with — we send you a link, so there is no password to remember — and it opens in the browser you are already using. Nothing to install. Cancel and access stops.