Seasonal patterns that survived the one test that matters
Every seasonality tool can show you a stock that rose every October. So can a coin, flipped often enough. Ours had to pass a harder exam: every pattern was found using only the years before 2018, then kept only if it repeated in at least 75% of 2018–2025 — eight years the search never touched. 279 windows across 248 stocks made it through.
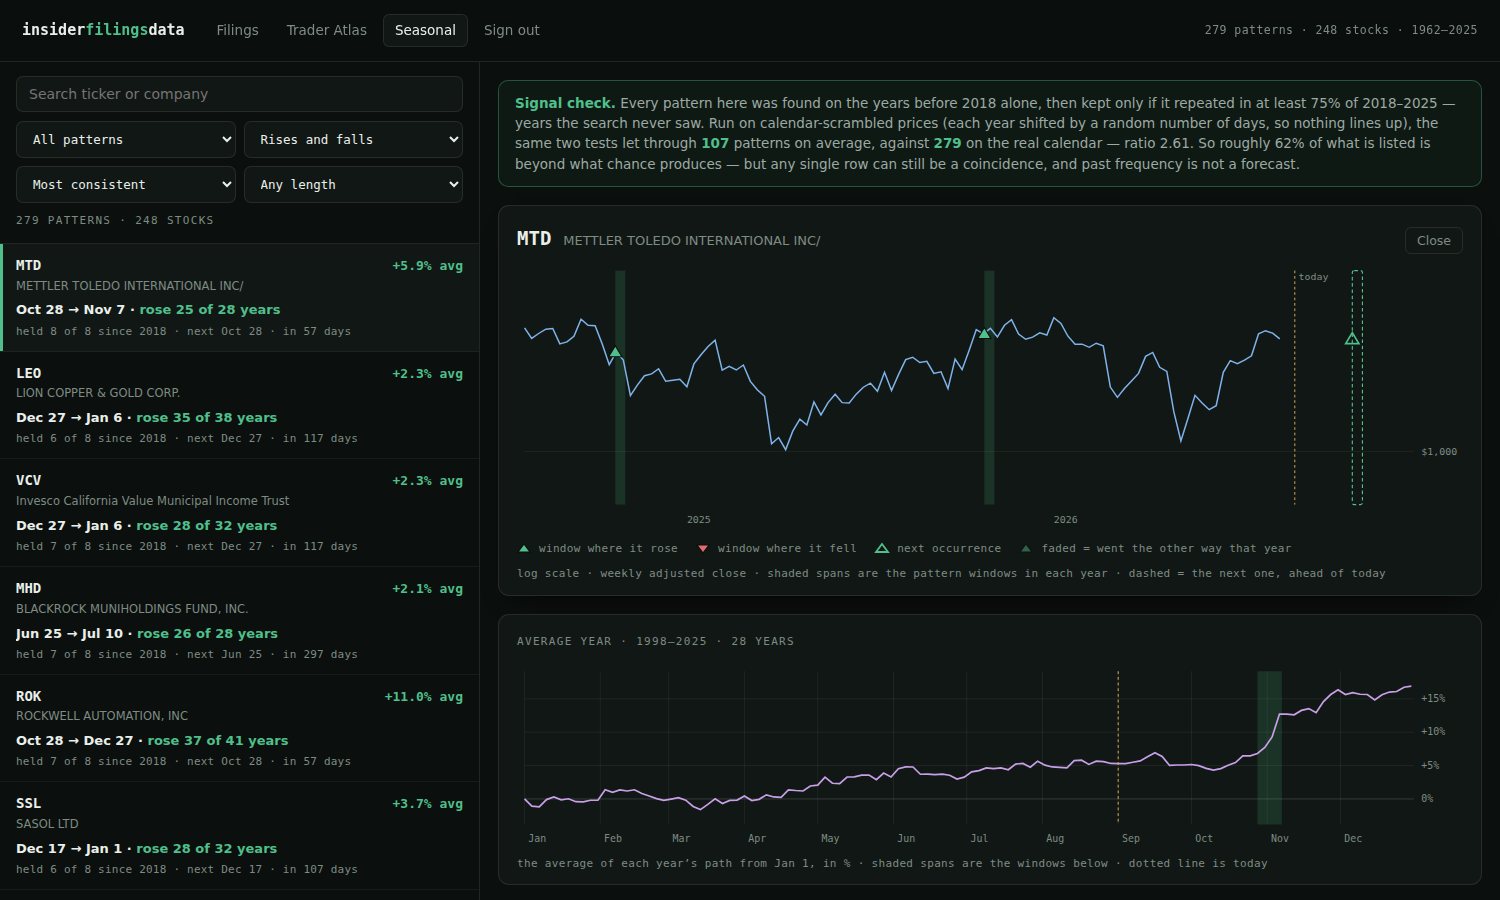
What a pattern looks like here
Mettler-Toledo, above. Between October 28 and November 7 it rose in 25 of the last 28 years — and the part that matters: the window was identified from 1998–2017 alone, and then rose in 8 of the 8 years since, averaging +6% while the market averaged roughly nothing over those same days. Rockwell Automation from late October: up in 37 of 41 years, 7 of 8 since 2018. Louisiana-Pacific from mid-November: 41 of 46, 7 of 8 since. Every row on the page carries both records, so you always see how the pattern did on data it was not fitted to.
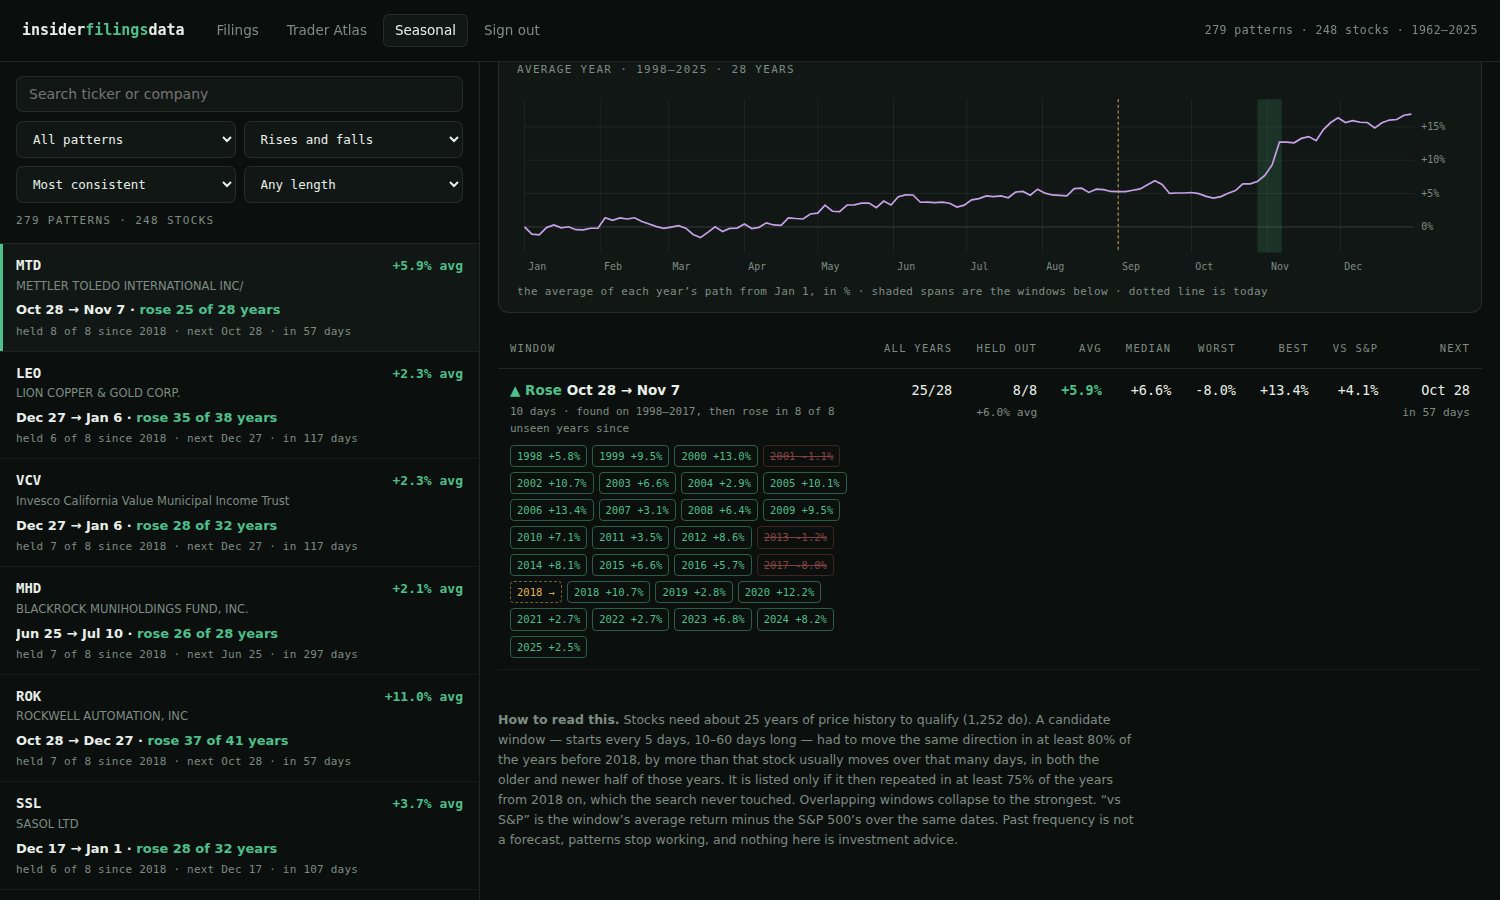
Click any pattern and every single year is laid out — including the years it missed, struck through, and an amber marker where the holdout begins. Nothing is smoothed away.
The honesty test, on the page itself
Here is the problem with stock seasonality, stated plainly: scan enough calendar windows across enough stocks and you will find thousands of "patterns" in pure noise. We measured exactly that. The same two-stage search, run on calendar-scrambled prices — each year's path shifted by a random number of days, so nothing can genuinely line up between years — lets 107 patterns through. The real calendar produces 279. That ratio sits in a banner at the top of the page, recomputed on every weekly rebuild: roughly 6 in 10 of the listed patterns are beyond what chance produces, and any single one can still be a coincidence. We would rather tell you that than sell you arrows.
What you get
64 years of prices
Daily history back to 1962 where it exists. A stock needs about 25 years to qualify — enough for the statistics to mean something.
Every year shown
Hit counts, averages, worst year, best year, the S&P comparison, and each year's actual return — the misses included.
The next occurrence
Filter to windows starting in the next 45 days or in progress now; each one is drawn ahead of today on the price chart.
The page is one of four tools in the members area, next to the Filings Browser, the Trader Atlas and the Formations study, all built on the same dataset you can download a free quarter of. Everything on it is historical description — past frequency is not a forecast, and none of it is investment advice.