Insider sentiment, week of Oct 5, 2026: 22% of insider filings were buys
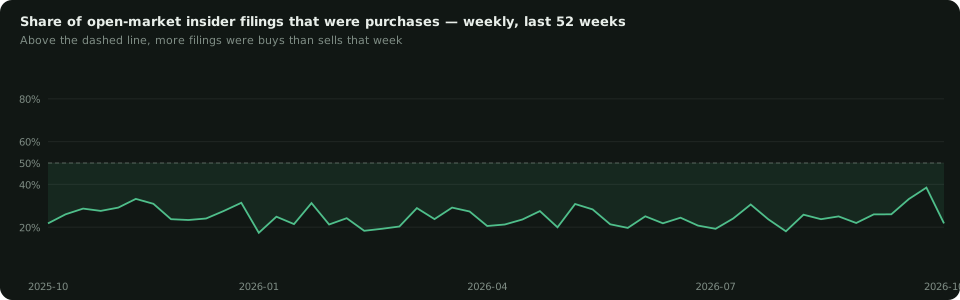
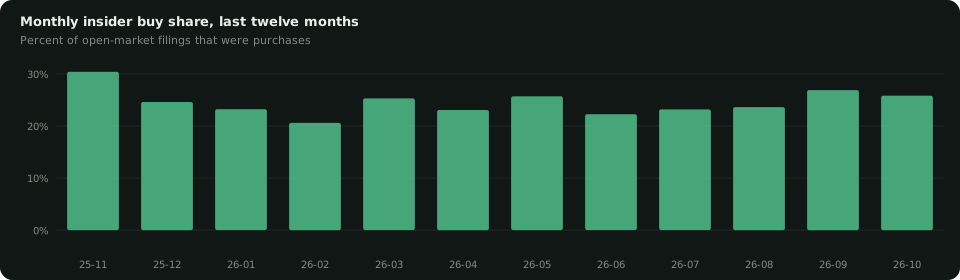
In the week starting Monday, October 5, 2026, insiders across the US market filed 166 open-market purchases and 597 open-market sales, so 22% of the activity was buying. Over the last 52 weeks the average is 25%; this week sits at the bottom 29% of that range.
Reading it
Insiders sell for many reasons — diversification, taxes, a house, a pre-arranged 10b5-1 plan — and buy on the open market for one: they think the price is wrong. That asymmetry is why the buy share is a contrarian gauge. It rises in sell-offs, when executives step in, and sinks in long rallies, when the same people cash out. The index has spiked above 60% only in broad market drawdowns.
This week sits close to its yearly average — nothing unusual in the aggregate. The information, when there is any, is in the individual names: the clusters where several insiders bought the same stock at once.
Last eight weeks
| Week of | Buys | Sells | Buy share | Bought | Sold | Tickers bought |
|---|---|---|---|---|---|---|
| 2026-10-05 | 166 | 597 | 22% | $506.2M | $2.89B | 80 |
| 2026-09-28 | 264 | 422 | 38% | $867.1M | $1.40B | 137 |
| 2026-09-21 | 227 | 457 | 33% | $753.1M | $2.25B | 137 |
| 2026-09-14 | 317 | 902 | 26% | $600.0M | $7.68B | 191 |
| 2026-09-07 | 236 | 673 | 26% | $577.2M | $1.99B | 140 |
| 2026-08-31 | 285 | 1,012 | 22% | $646.6M | $3.09B | 177 |
| 2026-08-24 | 303 | 906 | 25% | $950.8M | $6.94B | 187 |
| 2026-08-17 | 373 | 1,198 | 24% | $733.9M | $5.59B | 221 |
By month, last year
Questions this post answers
What is the insider sentiment index?
The share of open-market insider filings across the whole US market that were purchases rather than sales, computed weekly from SEC Form 4 filings since 2019. One filing counts once per side; grants, option exercises and tax withholding are excluded.
How bullish were insiders in the week of Oct 5, 2026?
22% of open-market filings were buys (166 buys, 597 sells), against a 52-week average of 25%.
Is a high buy share a buy signal for the market?
It has been a contrarian gauge: readings above 60% have coincided with market drawdowns, when insiders bought into weakness. It says insiders are finding value, not that prices will rise next week. Average tilts, not predictions.
Where does the data come from?
SEC EDGAR Forms 3, 4 and 5, parsed into a database and refreshed every morning. The weekly and monthly series are free on the sentiment page and via the members JSON API.