Trader Atlas spotlight: RA Capital Nexus Fund, L.P. — 21 insider buys, 52% beat the market
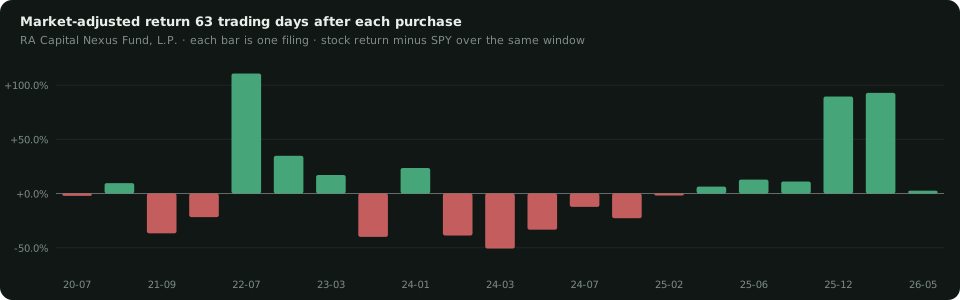
The Trader Atlas ranks every insider with at least five qualifying open-market purchases by the market-adjusted return that followed them. Today's entry is RA Capital Nexus Fund, L.P.: 21 purchases between Jul 2, 2020 and May 13, 2026, $537.3M in total, a median excess return of +2.6% over the following 63 trading days, ranked 337 of 447.
The record
| Filed | Ticker | Bought | Price paid | Price · 63d later | Stock return | SPY | Excess |
|---|---|---|---|---|---|---|---|
| 2026-05-13 | ARTV | $75.0M | $10.50 | $11.30 | +7.6% | +5.1% | +2.6% |
| 2026-01-07 | CLYM | $25k | $4.20 | $8.05 | +91.7% | -1.1% | +92.8% |
| 2025-12-15 | CLYM | $755k | $3.81 | $7.12 | +86.9% | -2.5% | +89.4% |
| 2025-06-16 | TYRA | $1.7M | $10.22 | $12.36 | +20.9% | +9.8% | +11.1% |
| 2025-06-11 | TYRA | $1.9M | $10.18 | $12.47 | +22.5% | +9.7% | +12.8% |
| 2025-06-06 | TYRA | $11.8M | $10.55 | $12.13 | +15.0% | +8.6% | +6.4% |
| 2025-02-03 | ETNB | $50.0M | $9.29 | $8.61 | -7.3% | -5.5% | -1.9% |
| 2024-11-13 | TYRA | $19.8M | $15.74 | $12.59 | -20.0% | +2.7% | -22.8% |
| 2024-07-24 | ARTV | $100.0M | $11.80 | $11.30 | -4.2% | +8.1% | -12.3% |
| 2024-07-01 | ELYM | $50.0M | $7.05 | $5.09 | -27.8% | +5.5% | -33.3% |
| 2024-03-29 | NKTX | $30.0M | $10.82 | $5.85 | -45.9% | +4.8% | -50.7% |
| 2024-03-06 | ETNB | $20.7M | $12.13 | $8.07 | -33.5% | +5.2% | -38.7% |
Showing the 12 most recent of 21 qualifying purchases. The full list is on the members Atlas.
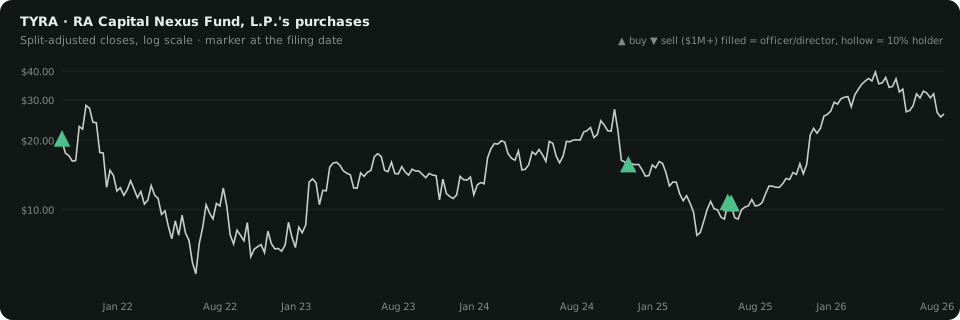
TYRA: where the buys sat on the price
How to read a track record
Every trade is scored the same way: the stock's total return over the 63 trading days after the filing date — the day the market could know — minus SPY over the same days. A high median excess return with only a handful of trades in one ticker can be luck; the members Atlas shows the dispersion, the tickers and every marker on the chart so you can judge. Past filing activity by any insider says nothing reliable about future prices; the Atlas is a way of looking at what has already happened.
447 insiders, ranked, every buy on the chart
The Trader Atlas is one of seven tools in the members area. Pick any insider and see every open-market purchase plotted on the share price, with the 63-day outcome beside it.
Open the AtlasFree sampleQuestions this post answers
What is RA Capital Nexus Fund, L.P.'s insider trading track record?
21 qualifying open-market purchases since 2020 across 9 tickers, $537.3M in total. 52% beat the S&P 500 over the following 63 trading days, with a median excess return of +2.6%.
What is the Trader Atlas?
A ranking of 447 insiders drawn from 5,228 filers and 122,816 open-market buys — every insider with at least five qualifying purchases, sorted by the median market-adjusted return that followed them.
What counts as a qualifying buy?
A Form 4 transaction with code P, an open-market purchase. Grants, option exercises, gifts and dispositions are excluded, and tickers whose price history has unadjusted split artifacts are dropped rather than left to produce impossible numbers.
Should I copy this insider's trades?
No. The Atlas describes what happened after past filings; a handful of trades can look brilliant by chance. Nothing on this site is investment advice.