Seasonal windows opening in the next 21 days: 53 patterns that held up out of sample
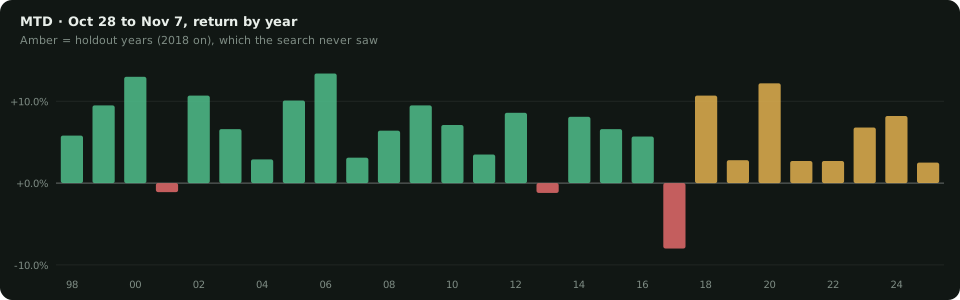
Every pattern on this list was found using only prices before 2018, then kept only if it repeated in at least 75% of 2018–2025 — years the search never saw. 53 of the 283 surviving windows start in the next 21 days. The one with the strongest statistics is Mettler Toledo International Inc/ (MTD): up in 25 of 28 years between Oct 28 and Nov 7, 8 of 8 since 2018, averaging +5.9% against a market average of +4.1% over the same days.
Opening soon
| Ticker | Company | Window | Dir | Years | Hit rate | Since 2018 | Avg | Market | Worst |
|---|---|---|---|---|---|---|---|---|---|
| MTD | Mettler Toledo International Inc | 10-28 → 11-07 | up | 28 | 25/28 · 89% | 8/8 | +5.9% | +4.1% | -8.0% |
| ROK | Rockwell Automation, Inc | 10-28 → 12-27 | up | 41 | 37/41 · 90% | 7/8 | +11.0% | +7.6% | -6.6% |
| UVSP | Univest Financial Corp | 10-23 → 12-22 | up | 28 | 23/28 · 82% | 7/8 | +5.0% | +1.3% | -12.2% |
| MRVL | Marvell Technology, Inc. | 10-28 → 11-07 | up | 25 | 22/25 · 88% | 7/8 | +6.6% | +5.1% | -4.6% |
| CET | Central Securities Corp | 10-28 → 11-07 | up | 46 | 38/46 · 83% | 6/8 | +2.7% | +1.1% | -2.7% |
| PH | Parker-Hannifin Corp | 10-28 → 11-27 | up | 46 | 41/46 · 89% | 8/8 | +7.2% | +4.3% | -10.2% |
| GATX | Gatx Corp | 10-28 → 11-07 | up | 41 | 34/41 · 83% | 7/8 | +3.5% | +1.6% | -4.6% |
| NBTB | Nbt Bancorp Inc | 10-23 → 12-07 | up | 34 | 31/34 · 91% | 8/8 | +6.4% | +2.9% | -5.8% |
| TTC | Toro Co | 10-28 → 12-27 | up | 46 | 40/46 · 87% | 8/8 | +8.0% | +4.0% | -13.0% |
| CNXN | Pc Connection Inc | 10-23 → 11-07 | up | 28 | 24/28 · 86% | 7/8 | +8.8% | +6.7% | -7.8% |
"Since 2018" is the holdout: how the window did in years the search never touched. "Market" is the S&P 500 over the same calendar days, averaged over the same years. Sorted by t-statistic.
Mettler Toledo International Inc/: every year, misses included
The honesty test
Scan enough calendar windows across enough stocks and you will find thousands of "patterns" in pure noise. We measure exactly that: the same two-stage search run on calendar-scrambled prices lets 106 patterns through, against 283 on the real calendar — a ratio of 2.7. Roughly 62% of the listed patterns are beyond what chance produces, and any single one can still be a coincidence. We would rather tell you that than sell you arrows.
All 283 windows, drawn ahead of today on the chart
The members Seasonal page shows every surviving pattern with each year's actual return, the next occurrence marked on the price chart, and filters for windows starting in the next 45 days or in progress now.
Open the Seasonal pageFree sampleQuestions this post answers
Which seasonal stock patterns start in the next 21 days?
53 windows that passed the out-of-sample test. The strongest by t-statistic: MTD (10-28, 25/28 years), ROK (10-28, 37/41 years), UVSP (10-23, 23/28 years), MRVL (10-28, 22/25 years), CET (10-28, 38/46 years).
How were these seasonal patterns found?
Each stock's daily history back to 1962 where it exists was scanned for calendar windows using only years before 2018, requiring at least 17 years of data. A pattern was kept only if it then repeated in at least 75% of 2018–2025. 283 windows across 252 stocks survived.
Are seasonal patterns real or data mining?
Some of both, and the page says so: the same search on calendar-scrambled prices produces 106 patterns versus 283 on the real calendar. That ratio is recomputed on every weekly rebuild and shown on the page.
Is this a trading signal?
No. These are historical hit rates with wide year-to-year dispersion, shown with every miss included. Not investment advice.